

utilities permission.
Meters
A meter is the physical device installed at a connection. Open a connection and select the Meters tab to see every meter on that connection in a data grid.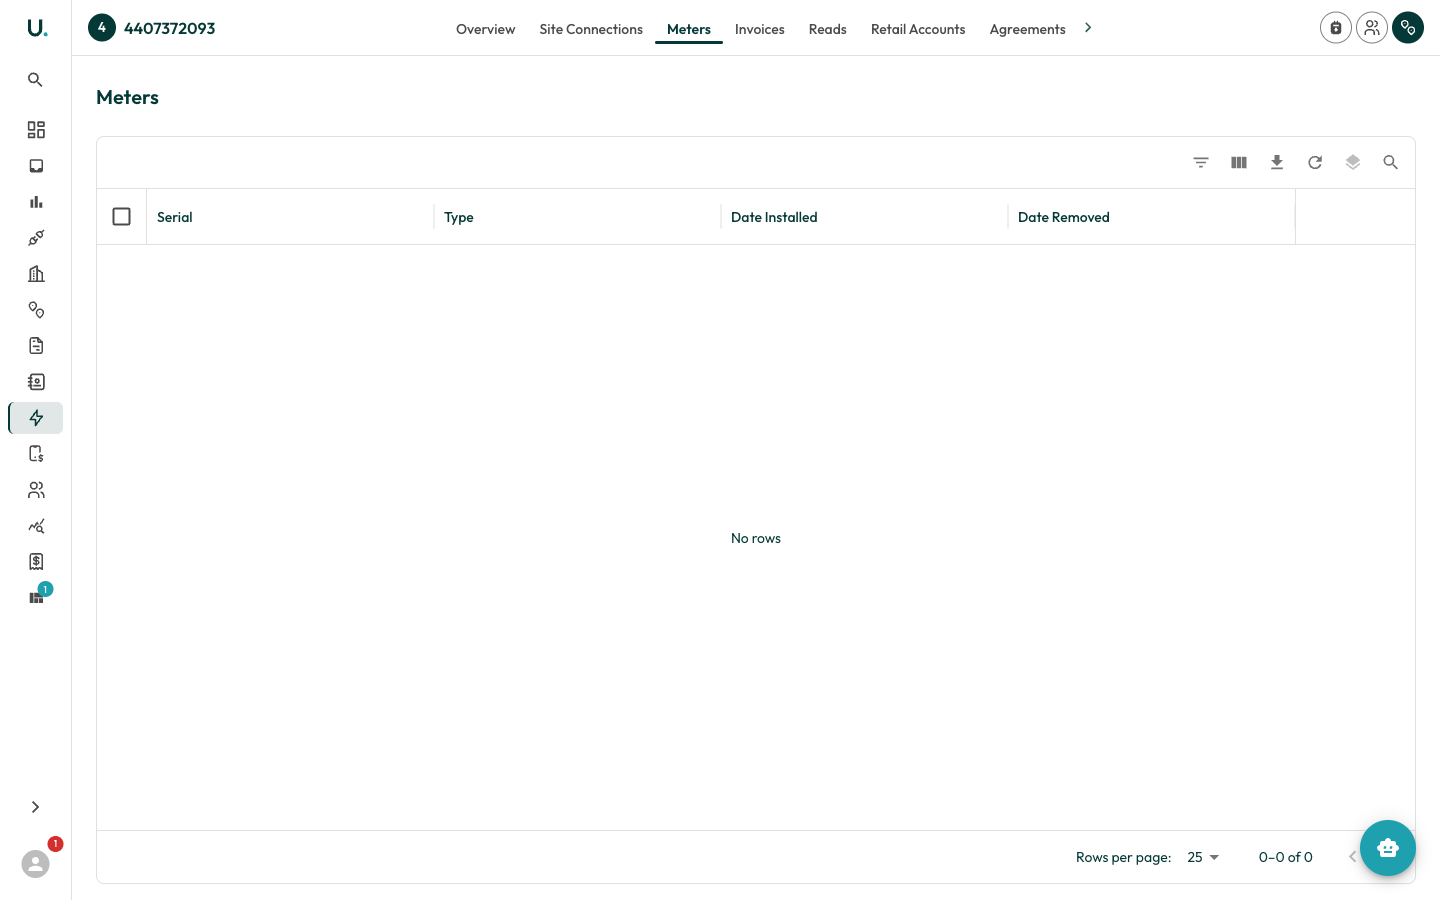
Opening a meter shows Overview, Settings, Registers, and Reads tabs. The Overview tab summarises the meter’s active status, serial number, type, description, install and removal dates, and a link back to its parent connection.
Registers
A register is a measurement channel on a meter — for example, separate channels for peak and off-peak usage, or for import and export. Open a meter and select the Registers tab to list its registers.
Opening a register shows Overview, Settings, and Reads tabs. The Overview tab surfaces the register’s serial, base units, interval length, accumulator type, flow direction, active status, and a link to its parent meter.
Reads
Reads are the time-series measurements a register records — the raw consumption data that underpins validation, modelling, and brokerage. View individual reads on a register’s Reads tab, or see aggregated reads with charting on a connection’s Reads tab.
Reads are sorted by Date then Interval, most recent first.