

NMI, a gas MIRN or a water meter reference. Each connection sits under a site and carries its meters, reads, retail accounts, agreements and invoices.
Find it in the sidebar under Portfolio › Connections. You need access to the Utilities module.
Hub tabs
The Connections hub groups everything about metering and pricing into tabs.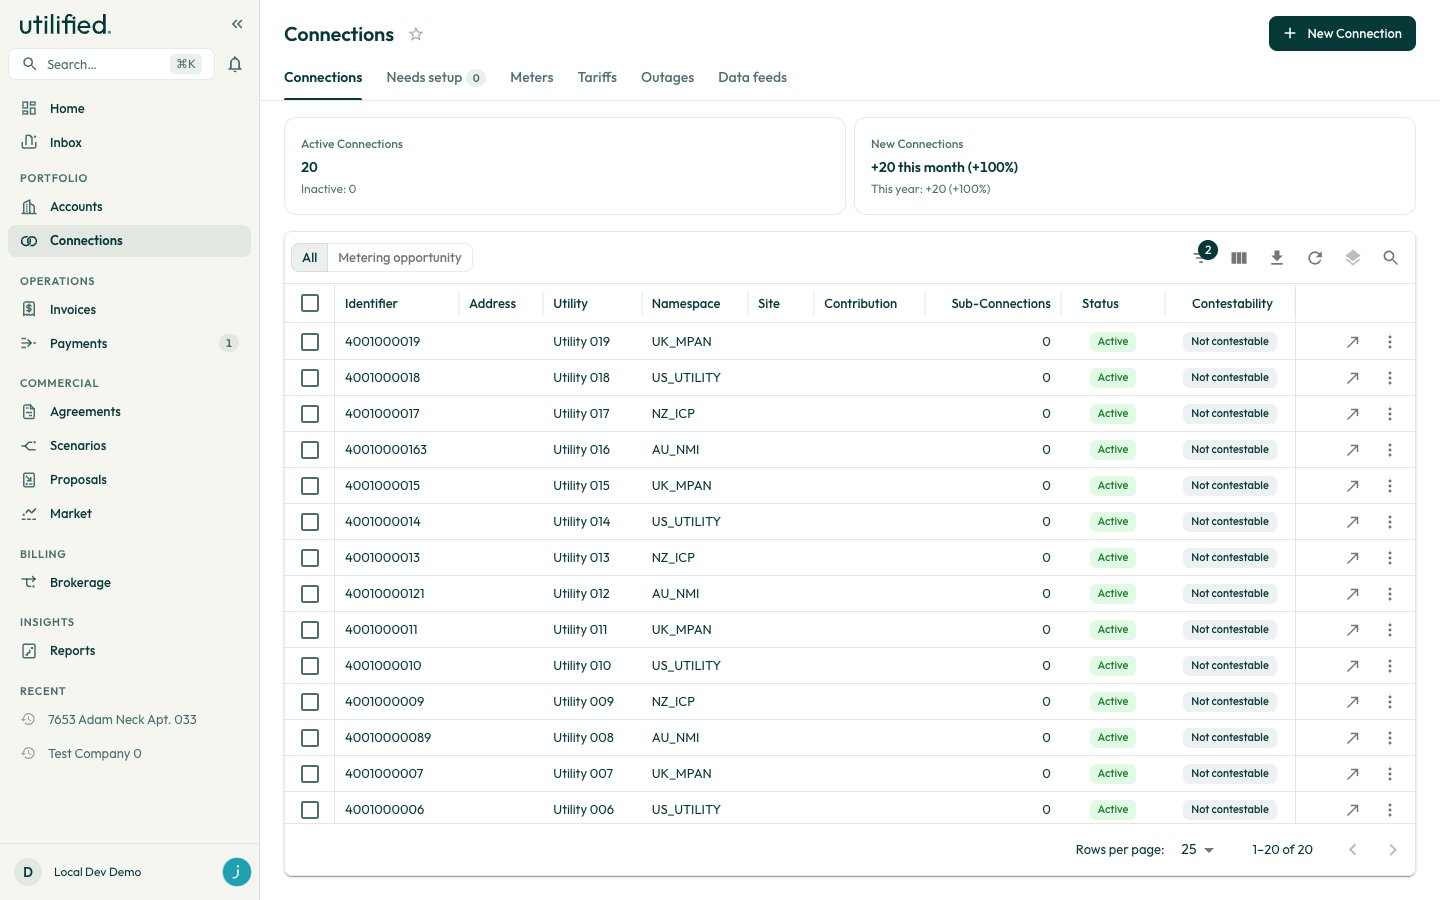
Connections list
The Connections tab lists your connections in a grid. It shows top-level connections only. A connection with sub-connections can be expanded to show them. Use the view switch at the top of the grid to change the list:
To follow up metering opportunities in more depth, see Tracking metering coverage.
New Connection
Click New Connection to open the Create New Connection drawer. The form is grouped into sections: Connection Information (identifier, address, utility and namespace; all but the address are required), Hierarchy, Loss Factors, Annual Usage, Dates and Additional Data. The drawer doesn’t ask for a site. Link one afterwards with Add to Site on the connection’s page. For a step-by-step walkthrough, see Managing connections.Needs setup
When invoice extraction reads a connection identifier that matches no connection in UMS, it lands on Needs setup. Each row shows the identifier, its namespace, the suggested utility, how many invoices it appears on and the address if one was read. The tab shows a count of rows waiting. Click Create connection on a row to open a form pre-filled from the invoice. Check the identifier, namespace and utility, add an address, and optionally pick a site. Where the invoice gave a distributor or loss factor codes, the form shows them so you can set loss factors after creating the connection. Saving creates the connection and links it to the invoices that mentioned it. When every identifier is matched, the tab reads Nothing to set up.Outages
Outages lists distributor outage notices that match your connections. Use the view switch to choose Live, In progress, Upcoming or Recently ended. The In progress and Upcoming views show a count. The grid shows each outage’s Network, Kind, Phase, Window, Sites affected, ETR (estimated time of restoration) and Cause. Click a row to see the connections it affects.
A connection with a current or upcoming outage also shows a banner on its Overview tab.
Connection detail
Click a connection’s identifier to open it. The header shows the identifier, the address (or site name) and an Active or Inactive status.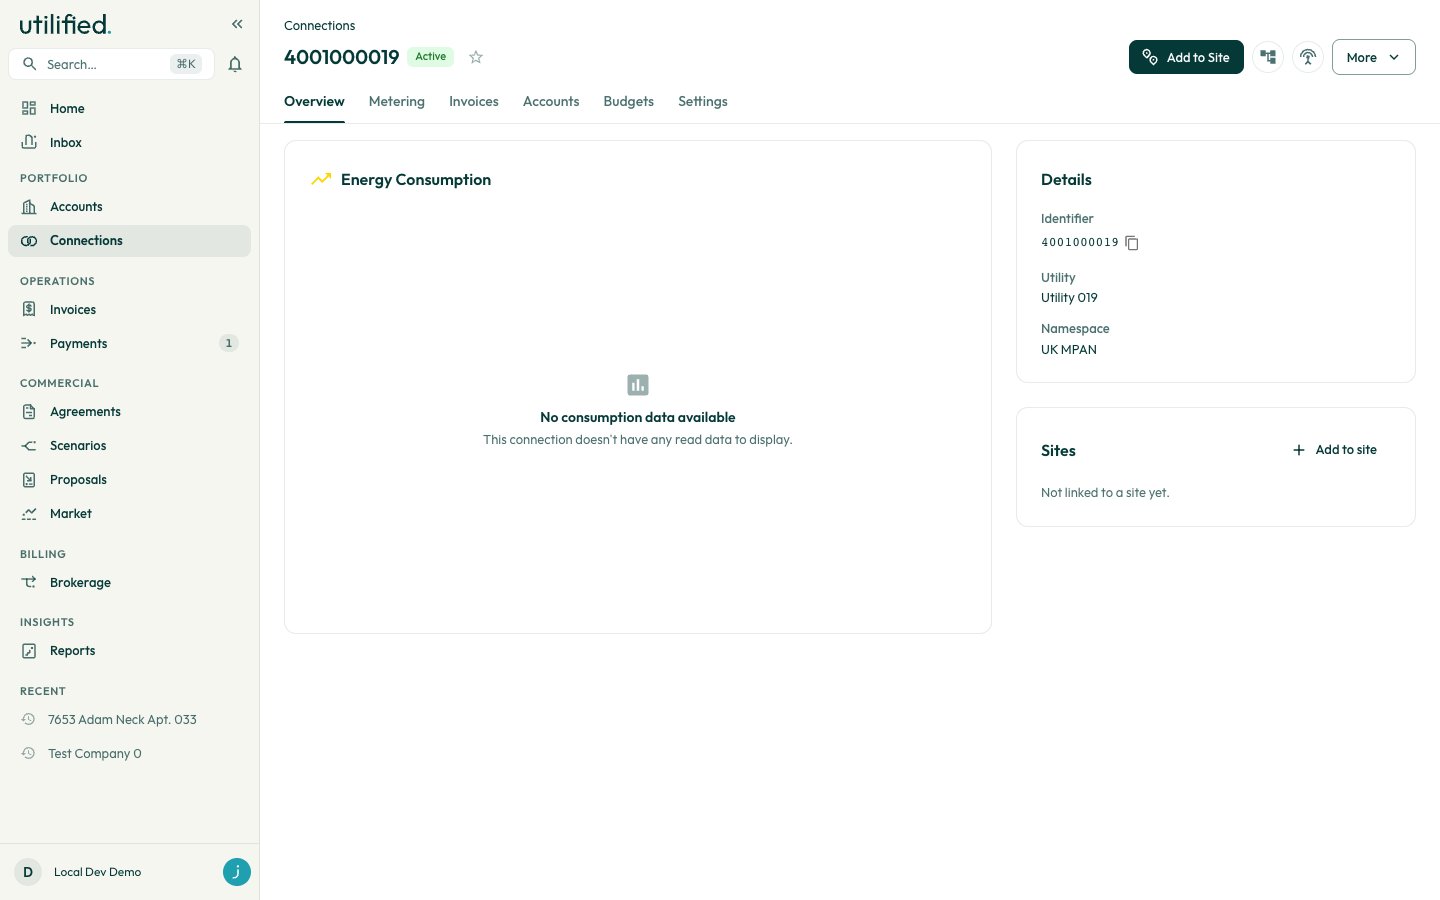
Tabs
Header actions
Only Add to Site shows a label. The others are icon buttons; hover to see their names.
Overview
- Consumption chart: reads over the last 12 months, with drill-down. Download the visible data as CSV from the chart. For a full export, use Metering › Reads.
- Details: identifier, utility, namespace, the annual estimate, loss factors when set, and the parent or sub-connection count.
- Sites: the sites the connection is linked to.
- Location: the site on a map.
Metering
Pick a segment with the switch at the top of the tab.
Usage analytics only appears when it’s enabled for your organisation and you have access to analytics. The Data feeds segment also shows SolisCloud access and Sungrow iSolarCloud access panels to users with permission to manage inverter sign-ins.
Invoices
Accounts
Pick a segment with the switch at the top of the tab.Budgets
The budgets set for this connection.Settings
Sub-connections
A sub-connection gets its site, retail accounts and agreements through its parent. On a sub-connection’s page:- The Accounts and Budgets tabs are hidden.
- Add to Site, Add Sub-Connection and New Retail Account are hidden.
- Metering has no Sub-connections segment, because a sub-connection can’t have its own.
- Overview shows Sub-connection of with a link to the parent, and the Contribution.