/scenarios). The list shows every scenario in your organisation with its Status (DRAFT, CALCULATING, COMPLETED, or FAILED), type, period, and when it was last calculated.
The current UI builds Tariff Review scenarios. Other scenario types (Solar/BESS, PFC, Procurement) exist as labels but are not yet wizard-driven.
Creating a scenario
From the Scenarios page, click the + (New Tariff Review) action in the header to open the Tariff Review Wizard.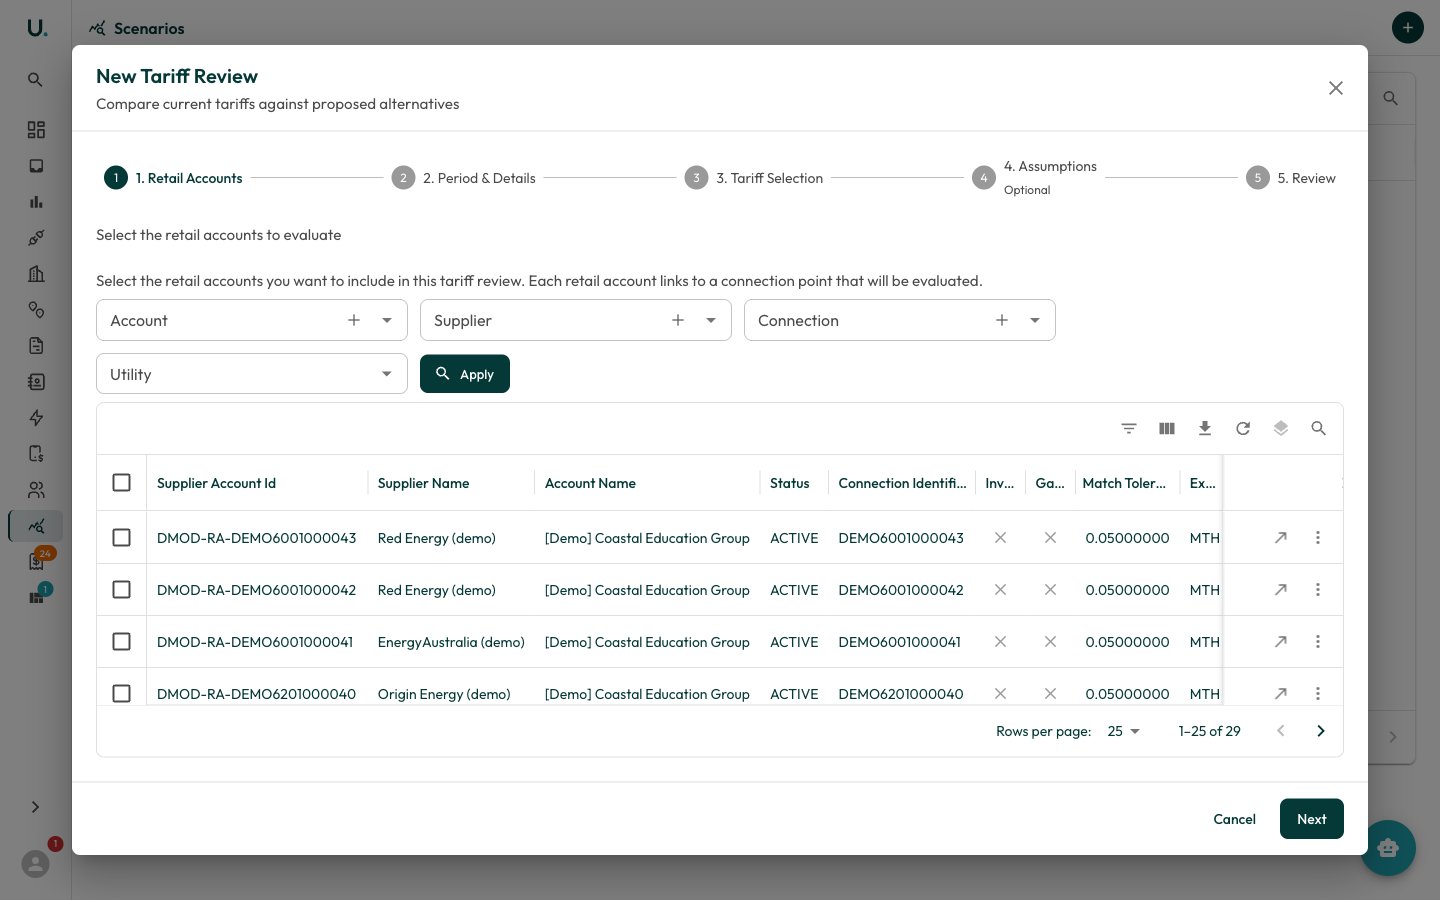
Select retail accounts
Choose one or more retail accounts to evaluate. These are the connections whose costs you want to model.
Set the period and details
- Choose a Period Type — Custom Date Range or Annualised (12 months).
- Set Period From and Period To. This determines which tariff versions and meter data are used.
- Give the review a Name (for example,
Q1 2026 Tariff Comparison) and an optional description.
Choose tariffs to compare
Select Current Tariff Groups (what the accounts are on today) on the left and Proposed Tariff Groups (the alternatives) on the right. See Managing Tariffs for how these are built.
- Assignment Mode — pick Apply to All to use the same tariffs for every connection, or Per Connection to assign tariffs to each connection individually.
- Where a tariff group has multiple versions, expand version overrides to pin a specific version (the latest is used by default).
Provide assumptions (optional)
The wizard detects quantities it can’t source from meter data for your connections and period:
- Load Profiles — assign a load profile and Annual Consumption (kWh) to generate synthetic interval data when no meter reads exist.
- Missing quantities — values flagged No data must be entered to include those charges. For demand-style quantities you can estimate from annual consumption using the calculator action.
- Quantity overrides — optionally override system-calculated demand values.
Reviewing results
While a scenario isCALCULATING, its detail page polls for completion and the Overview tab shows a progress indicator. Once COMPLETED, the Overview tab summarises the comparison.
- Summary cards — Status, Current Cost, Best Proposed option, and Potential Savings (or Additional Cost) with the percentage difference.
- Actual / Annualised toggle — switch between the actual period cost and a 365-day annualised figure.
- Cost Comparison — a bar chart of current versus each proposed tariff.
- Category Breakdown (Current) — current charges split by category.
- Connection × Tariff Comparison Matrix — every connection against every tariff option, with the cheapest option per connection highlighted.
Scenario items
The Scenarios tab lists each tariff item per connection — its Type (CURRENT or PROPOSED), tariff group, supplier, and charges (ex GST, GST, inc GST). Click a row to expand its line items and any warnings. Use Add Tariff to add another current or proposed tariff group to a connection after the fact.
Comparing and iterating
ACOMPLETED scenario offers two header actions:
- Recalculate — rerun the calculation after editing items or assumptions.
- Clone — copy the scenario as a new
DRAFTso you can tweak inputs and compare a fresh run without losing the original.